Global PV Installations News Update: What Changed and What to Watch in 2026
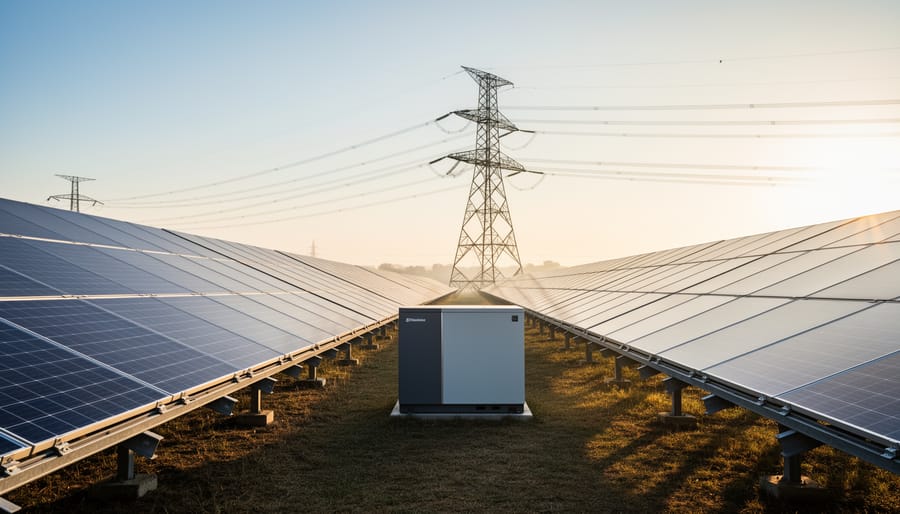
Global photovoltaic installations surged to 698 GW in 2025, pushing total worldwide capacity past 2.9 terawatts and marking a critical inflection point where integration challenges now rival pure capacity growth as the sector’s defining investment consideration. For those tracking alternative energy markets, this milestone represents more than incremental expansion. Solar now supplies over 10% of global electricity demand, cementing its position as the fastest-growing power generation technology while simultaneously exposing grid flexibility and storage bottlenecks that will shape capital allocation through the decade.
China continues to dominate with roughly 60% of new capacity, yet deployment breadth has matured considerably. Nearly 40 countries each installed at least 1 GW in 2025, with the European Union, India, and the United States driving robust growth outside traditional markets. This geographic diversification creates new entry points for investors while underscoring a fundamental shift: adding panels to grids is no longer the hard part.
What matters now is how those systems integrate with existing infrastructure, balance intermittent generation, and leverage energy storage to maintain reliability. Industry analysts point to this transition as the sector’s “new era,” where engineering and policy solutions around flexibility determine whether solar can scale beyond its current 12% share of electricity consumption. For both newcomers exploring renewable portfolios and experienced hands rebalancing positions, understanding these integration dynamics is essential to identifying where capital will flow next.
What Changed: Record-Breaking Installation Numbers in 2025
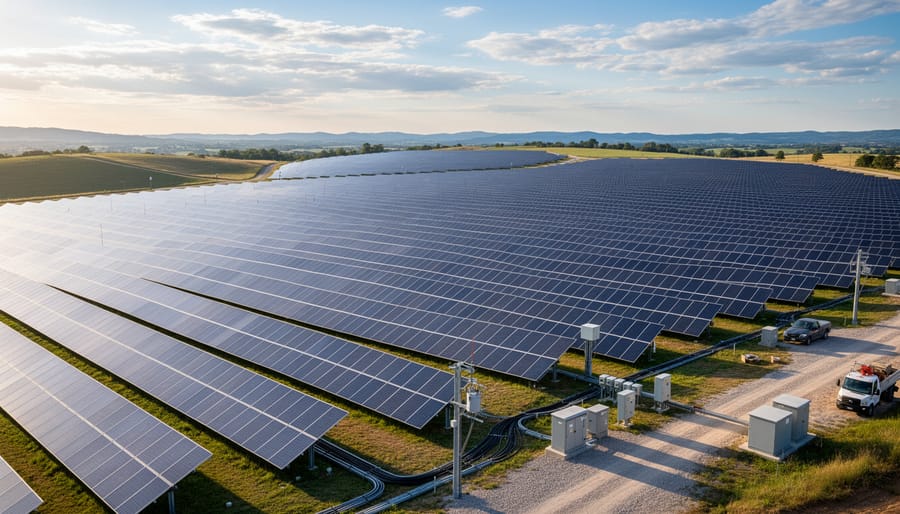
The numbers from 2025 tell a story of acceleration rather than incremental progress. According to the latest industry data, 2025 global PV nearly 3 TW of cumulative installed capacity, marking a jump of roughly 700 gigawatts in a single year. To put that in perspective, the world added 698 GW of new photovoltaic systems in 2025 alone, pushing total global capacity from 2.3 TW at the end of 2024 to nearly 3 TW by year’s end.
This wasn’t just a good year for solar. It was transformational. PV now supplies more than 10% of global electricity demand and accounts for around 12% of total electricity consumption, a threshold that cements its role as a mainstream power source rather than an alternative niche. The technology has officially crossed into the territory where it shapes grid planning, investment flows, and energy policy at the highest levels.
The growth rate itself deserves attention. PV remains the fastest-growing power generation technology on the planet, outpacing wind, natural gas, and every other generation type by a wide margin. That pace means investors and grid operators face a fundamentally different landscape than they did even two years ago. The question is no longer whether solar will play a major role in the energy transition, but how quickly the infrastructure can adapt to absorb this volume of new capacity without destabilizing grids or creating integration bottlenecks.
For anyone tracking energy markets or allocating capital in this space, 2025’s installation figures represent a clear inflection point. The sheer scale of deployment creates opportunities in downstream services, storage solutions, and grid management that didn’t exist when PV was a smaller slice of the generation mix.
Key Developments: Three Major Shifts Reshaping the Market
1. China’s Dominance Continues, Accounting for 60% of New Capacity
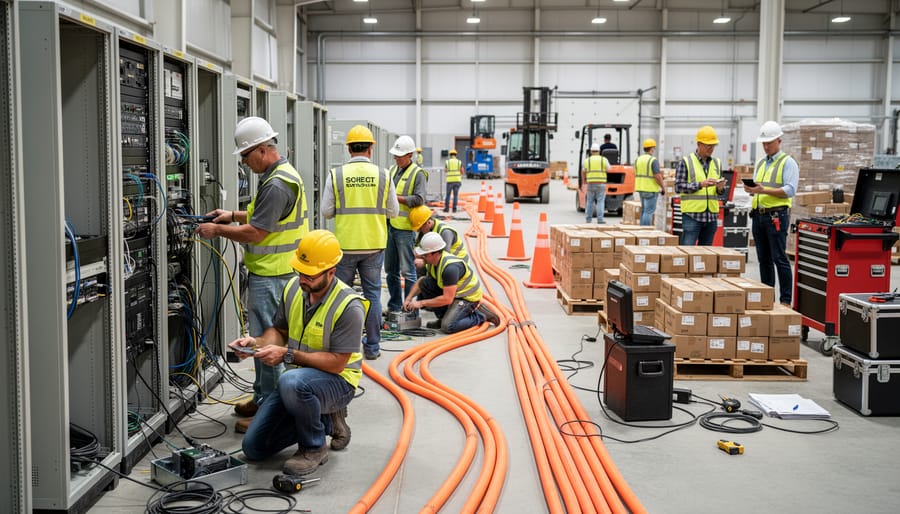
China’s 60% share of 2025’s new PV installations represents both the continuation of a decade-long trend and a pivotal concentration of market power that shapes everything from panel pricing to technology development. China drove around 60% of the 698 GW installed globally last year, translating to roughly 420 GW of new capacity within a single national market. This scale dwarfs any other country’s deployment and fundamentally influences the economics of solar energy worldwide.
The concentration creates a unique dynamic for investors. On one hand, China’s dominance means more predictable supply chains and aggressive cost curves driven by manufacturing scale. Panel prices remained under pressure throughout 2025 as Chinese production capacity continued to expand faster than global demand, benefiting project developers and end users but squeezing margins for manufacturers outside China. For investors focused on project-level returns rather than equipment manufacturing, this pricing environment creates compelling opportunities in markets with strong policy support.
Several structural factors sustain China’s leadership position:
- Vertically integrated manufacturing spanning polysilicon production through module assembly, creating cost advantages competitors struggle to match
- National and provincial policies that prioritize renewable energy deployment as both climate strategy and industrial policy
- Domestic electricity demand growth that absorbs massive installation volumes, particularly in coastal provinces and industrial zones
- State-backed financing mechanisms that reduce project capital costs and enable rapid scaling
For investors, this concentration presents both opportunity and risk. The supply chain advantages translate to lower system costs globally, making projects outside China more economically viable. However, the geographic concentration also creates exposure to policy shifts, trade actions, and potential supply disruptions. Diversification strategies that balance exposure to Chinese manufacturing strength with deployment opportunities in markets actively building domestic capacity offer the most robust approach for 2026.
2. Broadening Global Deployment: Nearly 40 Countries Pass the 1 GW Mark
While China drove the headline numbers, 2025 marked a turning point in how PV capacity spread across the globe. Nearly 40 countries surpassed the symbolic 1 GW threshold for new installations, a milestone that underscores how solar has evolved from a niche technology concentrated in a handful of markets to a mainstream energy source deployed at meaningful scale on every continent.
The European Union emerged as a key growth region outside China, reflecting both renewed climate commitments and energy security concerns that accelerated procurement timelines. India continued its aggressive buildout, driven by ambitious domestic targets and increasingly competitive project economics that now rival fossil fuel alternatives in many regions. The United States maintained robust deployment despite periodic policy uncertainty, supported by state-level mandates and corporate renewable energy purchasing agreements that created sustained demand across multiple market segments.
This geographic broadening carries direct implications for investors seeking diversification. Relying on a single dominant market, no matter how large, creates concentration risk tied to that country’s policy shifts, grid saturation points, and competitive dynamics. The emergence of nearly 40 gigawatt-scale markets means capital can now flow into jurisdictions with different regulatory frameworks, currency exposures, and growth trajectories. A portfolio spanning European grid integration projects, Indian utility-scale developments, and US distributed generation plays offers natural hedging that wasn’t feasible when deployment concentrated in just three or four major hubs.
Regional opportunities are shifting too. Markets crossing the 1 GW mark typically develop deeper supply chains, more sophisticated financing structures, and greater demand for specialized services, from grid connection expertise to performance optimization. For investors, this creates openings beyond pure manufacturing plays into project development, operations, and the ancillary technologies that enable higher penetration rates in diverse grid environments.
3. The Integration Era Begins: Storage and Flexibility Now Define Success
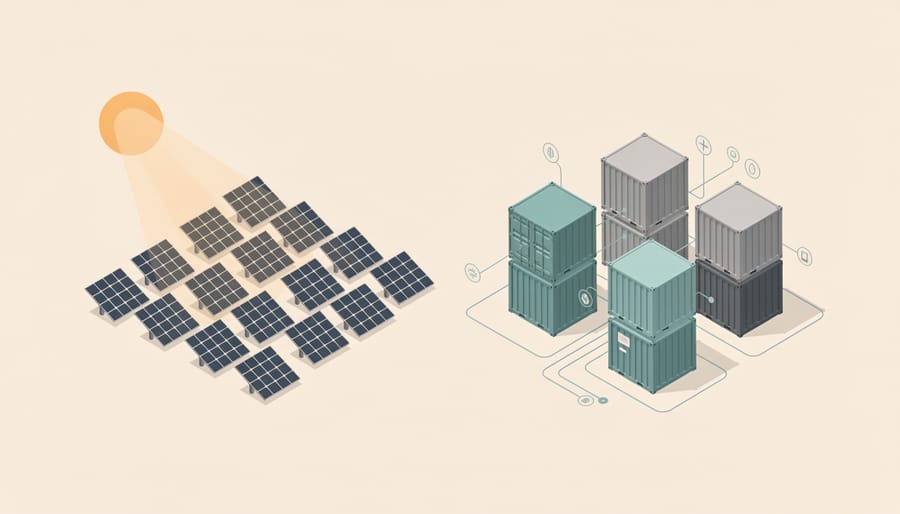
The industry has reached a turning point. According to the report’s lead author: “PV has entered a new era. Market growth remains strong, but system integration, flexibility and storage are now becoming the defining factors for the next stage of global deployment.” This statement captures the fundamental shift underway in 2026.
For two decades, the solar industry measured success primarily by capacity additions and cost reductions. Those metrics still matter, but they no longer tell the complete story. As PV systems supply over 10% of global electricity demand, grid operators face new challenges: managing intermittency, balancing supply and demand across different times of day, and maintaining system stability as variable renewables displace dispatchable generation.
This integration challenge creates distinct investment opportunities beyond traditional panel manufacturing. Energy storage systems represent the most obvious play. Batteries paired with PV installations smooth output variability, store excess midday generation for evening peaks, and provide grid services that enhance project economics. Advances in battery technology have made storage increasingly cost-effective, transforming standalone PV projects into dispatchable resources that command premium power prices.
Grid management technologies form another emerging sector. Software platforms that forecast generation, optimize dispatch schedules, and coordinate distributed resources become essential infrastructure as PV penetration deepens. Companies providing these solutions benefit from recurring revenue models rather than one-time equipment sales.
Hybrid systems combining PV with complementary technologies offer a third avenue. Solar thermal components can provide heat storage and dispatchable output that pure PV cannot deliver alone. These integrated approaches address the flexibility gap more comprehensively than battery storage in isolation, particularly for industrial applications requiring both electricity and process heat.
The investment thesis has evolved. Pure-play PV manufacturers face margin pressure in an oversupplied market. Companies offering complete energy solutions, generation plus storage, controls, and ancillary services, position themselves for sustained growth as the industry matures from deployment into optimization.
Why It Matters: Investment Implications for 2026 and Beyond
The record installations of 2025 signal more than impressive growth figures, they represent a fundamental reshaping of investment opportunities in the solar sector. For investors, the shift from pure capacity expansion to integration challenges creates distinct winners and losers across the value chain.
Supply chain dynamics have entered a new phase. China’s 60% market share in 2025 installations reinforces its manufacturing dominance, but also highlights concentration risk. Investors need to watch for diversification efforts in panel production, polysilicon refining, and wafer fabrication. The nearly 40 countries crossing the 1 GW threshold suggest emerging markets are no longer experimental plays, they’re becoming core portfolio components. India’s acceleration, EU policy support, and US manufacturing incentives all point to regional supply chains gaining traction, which matters for both risk management and opportunity identification.
The integration era fundamentally changes what drives returns. Panel manufacturers face margin compression as capacity outpaces differentiation. The real value is shifting to companies providing storage solutions, grid management software, and hybrid system design. Understanding how batteries work alongside PV systems isn’t optional anymore, it’s central to evaluating project economics and long-term viability.
This 2026 investment shift toward value-added services creates entry points for both novice and experienced investors. Beginners should focus on diversified funds that capture the entire integration stack rather than betting on individual panel makers. Experienced investors can target niche plays: battery management systems, inverter technology, hybrid PV-thermal projects, and grid optimization platforms.
The 10% share of global electricity demand marks an inflection point. PV is no longer alternative, it’s mainstream infrastructure. That changes everything from policy risk profiles to financing terms. Projects that once struggled for bankability now attract pension funds and institutional capital. For your portfolio, this means solar investments deserve serious allocation, not speculative sideline positions. The question isn’t whether to invest in solar anymore; it’s which part of the maturing value chain offers the best risk-adjusted returns for your strategy and timeline.
What to Watch: Key Indicators and Trends for 2026
Track these evergreen indicators to spot emerging opportunities as the PV industry shifts from pure capacity growth to integration challenges. Policy developments in major markets will shape deployment patterns throughout 2026 and beyond. Watch for regulatory changes in the European Union, United States, and India, where subsidy structures, grid access rules, and local content requirements directly impact project economics and regional investment attractiveness. Each market operates under different frameworks, and policy shifts can open or constrain opportunities for both domestic and international investors.
Storage deployment rates offer critical insight into the industry’s maturation. As PV systems mature beyond grid-connected installations, battery attachment rates reveal which markets are building genuine energy security rather than intermittent capacity. Projects pairing solar with storage command higher returns and better financing terms, making storage penetration a key metric for evaluating market sophistication.
- Policy announcements and subsidy changes in the EU, US, and India
- Battery storage attachment rates for new PV installations
- Grid infrastructure investment commitments and interconnection queue backlogs
- Hybrid PV-thermal system deployments and cost trends
- Manufacturing capacity additions outside China and supply chain diversification efforts
Grid integration projects deserve close attention from investors focused on alternative energy stocks. Interconnection backlogs, transmission upgrades, and smart grid investments signal whether regions can absorb rapid PV growth or face curtailment challenges. Markets solving these bottlenecks first will attract capital and deliver better project returns.
Cost trends for hybrid systems combining PV with solar thermal technology represent another frontier. As integration becomes the defining challenge, investors should monitor whether hybrid approaches gain commercial traction and what cost reductions emerge at scale. Manufacturing diversification beyond China also warrants tracking, particularly capacity additions in Southeast Asia, the Middle East, and North America that could reshape supply chain dynamics and create new regional investment opportunities.
Frequently Asked Questions
The surge in global PV installations has raised important questions for investors trying to understand what the numbers mean and how to position their portfolios. Here are answers to the most common queries we’ve seen from the Dforce Solar community.
How significant is reaching 3 TW of global PV capacity?
The jump from 2.3 TW in 2024 to nearly 3 TW in 2025 represents the fastest annual capacity addition in solar history. To put it in perspective, it took the industry decades to reach the first terawatt, yet we added nearly 700 GW in a single year, cementing PV’s position as the dominant growth technology in power generation.
Why does China account for 60% of new installations?
China’s dominance stems from aggressive policy support, a fully integrated domestic supply chain, and economies of scale that keep costs low. The country treats solar deployment as strategic infrastructure, with government backing at national and provincial levels driving rapid buildout that other markets struggle to match.
What’s the difference between installed capacity and actual generation?
Installed capacity measures the maximum power output under ideal conditions, while actual generation depends on sunlight hours, weather, and grid integration. A 1 GW solar farm might generate electricity equivalent to a 200-300 MW conventional plant running continuously, which is why PV supplies around 10-12% of global electricity despite higher capacity figures.
How do integration challenges affect investment returns?
The shift toward storage and flexibility requirements changes where value accrues in the solar value chain. Pure panel manufacturers face margin pressure, while companies offering battery storage, grid management software, and hybrid solutions capture premium returns as projects increasingly need these capabilities to function effectively.
These distinctions matter because they shape which investment opportunities offer the best risk-adjusted returns going forward. Understanding the gap between capacity numbers and actual electricity delivery helps explain why storage and integration technologies represent the next major growth area, even as panel installations continue their impressive trajectory.
The 2025 surge to nearly 3 TW of global PV capacity represents more than impressive numbers, it signals a fundamental transition in how the industry operates and where smart capital flows next. We’re moving from a decade defined by breakneck installation growth into an era where integration capabilities, grid flexibility, and hybrid storage solutions separate winning investments from stalled projects. This shift opens substantial opportunities in battery systems, smart grid infrastructure, and technologies that merge solar PV with thermal storage for round-the-clock reliability.
For investors at every level, staying ahead means tracking policy signals across major markets and understanding how regulatory frameworks in the EU, India, and the United States will shape regional deployment patterns through 2026. Join the Dforce Solar community to share insights on emerging integration plays, discuss which markets offer the best risk-adjusted returns, and learn from fellow investors navigating this new landscape. The capacity race delivered scale; the integration challenge will deliver value.