Alternative Energy News Update: What Changed and What to Watch in 2026
In the first quarter of 2026, utility-scale solar became the largest source of clean energy in the US, passing wind. No.
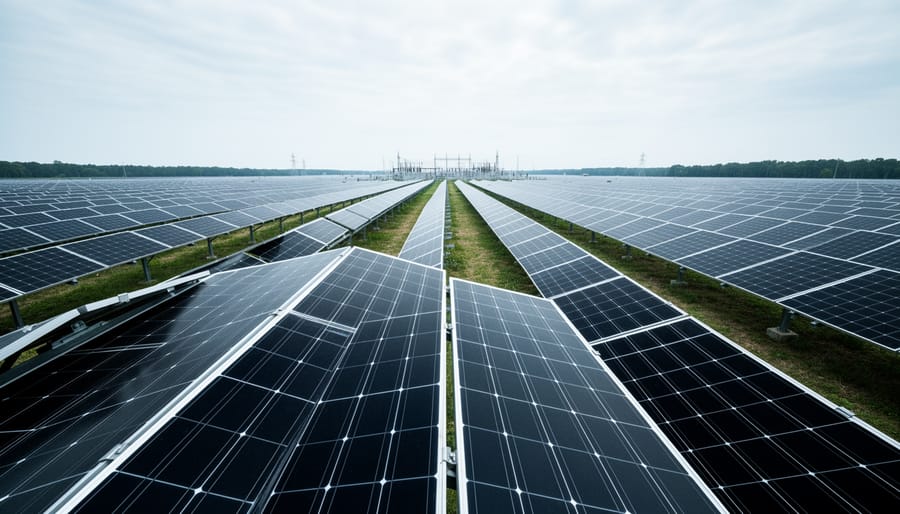
Utility-scale solar overtook wind as the largest source of clean energy in the US in the first quarter of 2026, and that shift is the headline for anyone tracking alternative energy right now. It matters because the leaderboard of American clean power has a new name at the top, and capital tends to follow momentum.
The broader picture backs it up. Renewables generated almost 948mn MWh in 2024, about 23pc of all US generation. The EIA expects that share to reach roughly 25pc in 2025 and 27pc in 2026, with output climbing from almost 1.1bn MWh to 1.2bn MWh. Developers were expected to add about 32,500MW of utility-scale solar in 2025, against about 7,700MW of new wind capacity. Wind isn’t fading, though. Wind farms are on track to provide about 506mn MWh in 2026, still ahead of the roughly 350mn MWh expected from utility-scale solar for the full year.
Below, we break down four verified developments, put the numbers in one scannable table, and explain what they mean for new and experienced investors alike. Some pieces remain unresolved, including policy changes and funding incentives, so we’ll flag those rather than guess. Share your own read on these trends with our community as you go.
What Changed: Solar Takes the Lead Among US Clean Energy Sources
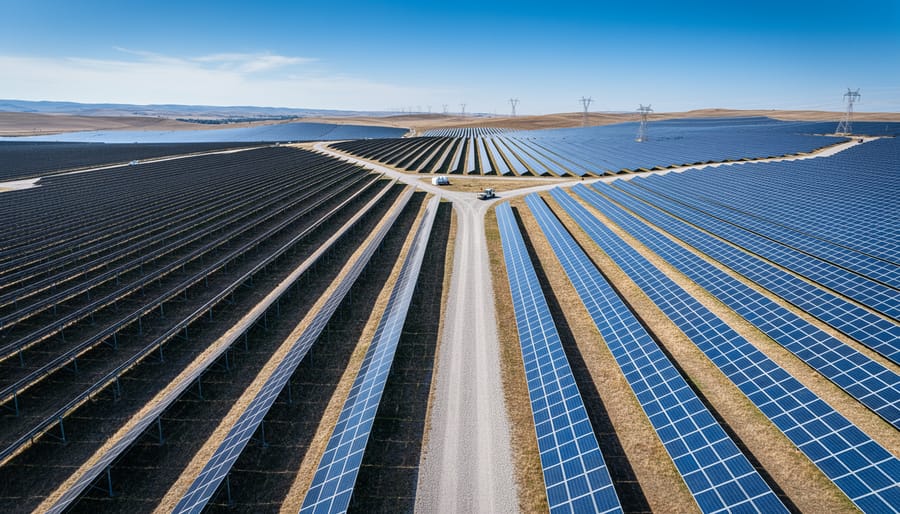
The headline shift is simple: in the first quarter of 2026, solar overtook wind as the largest source of clean energy in the US. For a long stretch, wind held that top spot among clean sources, so a change at the head of the pack is worth noticing.
Two terms are doing a lot of work here. “Utility-scale solar” means large solar farms that feed electricity into the grid for utilities to distribute, as opposed to panels on a rooftop. “Clean energy” refers to electricity generated without burning fossil fuels, which in the US mainly means solar, wind, hydropower, and similar sources.
It helps to read this as a shift in the mix rather than a verdict on any one energy source. Wind has not gone away, and it remains a major contributor to the grid. Traditional energy sources also remain part of the broader picture, supplying a large share of the power that keeps homes and businesses running. What changed is the ranking inside the clean energy category, not the importance of any single technology.
That rising share is the bigger backdrop. Renewables supplied about 23 percent of US generation in 2024, and the trend points upward from there. The details behind it are covered in the next section.
Key Developments Shaping Alternative Energy in 2026
1. Utility-Scale Solar Overtakes Wind in Q1 2026
In the first quarter of 2026, utility-scale solar overtook wind as the largest source of clean energy in the US. It’s a milestone worth pausing on, because it shows where the new build-out is concentrating.
To read the data clearly, it helps to separate two terms. Capacity is what a power source can produce at full tilt, measured in megawatts (MW). Generation is what it actually produces over time, measured in megawatt-hours (MWh). A solar farm might have plenty of capacity, but cloudy weather, nightfall, and seasons all shape what it delivers.
Capacity growth is a good clue to where developers are placing their bets. The EIA expects about 32,500MW of utility-scale solar to be added in 2025, compared with roughly 7,700MW of new wind capacity. That gap in additions helps explain why solar’s output has been climbing so quickly.
Keep in mind that this is a shift in the mix, not a verdict on wind. Wind remains a major contributor, and a single quarter is a snapshot rather than a permanent ranking. For investors, the takeaway is to watch capacity additions and actual generation together, since each tells a different part of the story.
2. Renewables’ Growing Share of US Electricity
The share of US electricity coming from renewables has been inching upward, and the numbers tell a clear story. Here is the year-by-year snapshot:
- 2024 (actual): almost 948mn MWh, about 23% of all US generation.
- 2025 (expected): almost 1.1bn MWh, roughly 25% of US generation.
- 2026 (expected): around 1.2bn MWh, roughly 27% of US generation.
Read that as a steady climb of about two percentage points a year. For newer investors, MWh (megawatt-hours) is simply a measure of electricity actually produced, so these figures reflect real output, not just installed equipment.
One caution matters here. The 2025 and 2026 numbers are expectations, not guarantees. They come from the EIA’s outlook, as covered in this EIA generation share outlook and actual results can land above or below projections depending on weather, grid demand and how quickly new projects come online.
Still, the direction is hard to miss. A bigger slice of the grid is being supplied by renewables, while traditional sources remain a significant part of the overall mix. Experienced investors will want to track how real generation compares with these forecasts as the data arrives.
3. Utility-Scale Solar Build-Out Momentum
The EIA expects developers to add about 32,500MW of utility-scale solar to the US grid in 2025. That’s a lot of new capacity arriving in a single year, and it helps explain why solar’s recent lead didn’t appear out of nowhere. For a wider view of how this compares with worldwide activity, see our look at global PV installations.
If those units feel abstract, here’s a simple way to think about them. A megawatt (MW) measures capacity, the most power a solar farm can deliver at a given moment. A megawatt-hour (MWh) measures energy actually produced over time. One MW running for one hour yields one MWh. Think of MW as the size of the engine and MWh as the miles actually driven.
That distinction matters for the next number. The EIA projects utility-scale solar farms will generate around 350mn MWh in 2026. Capacity added in 2025 is what makes that output possible, though real generation depends on sunshine, location, and how the grid operates. Treat the figures as expectations, not guarantees, and watch how actual results compare as the year unfolds.
4. Wind Capacity Additions and Output Outlook
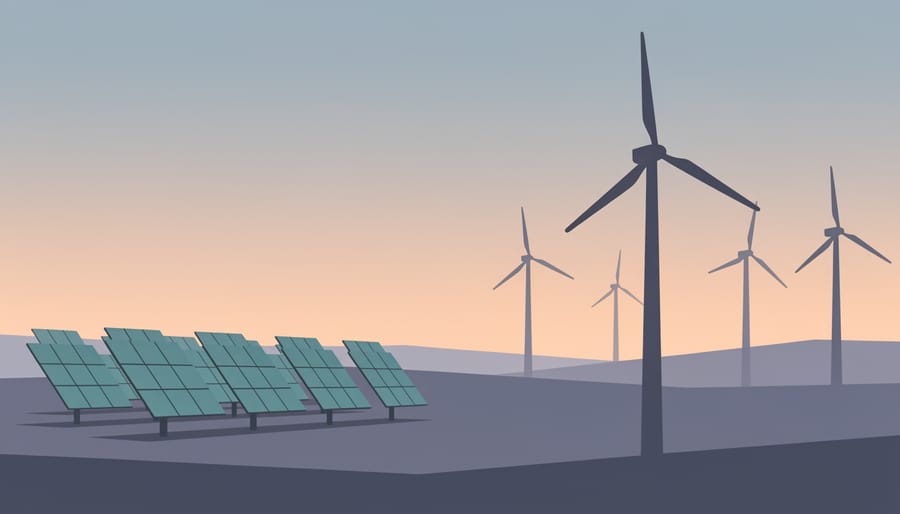
Wind hasn’t gone anywhere. The EIA anticipates about 7,700MW of new wind capacity coming online in 2025, a healthy build-out even if it’s smaller than the solar pipeline. Remember, capacity is what a project could produce under the right conditions, and generation is what it actually delivers to the grid.
On generation, Wind farms are on track to provide about 506mn MWh in 2026, compared with roughly 350mn MWh from utility-scale solar. So while solar grabbed the headline by overtaking wind as the largest source of clean energy in the first quarter of 2026, wind is still expected to generate more total electricity across the year. Those two facts can both be true because they measure different things and different time windows.
For newer investors, this is a handy reminder not to read one headline as the whole story. Solar’s momentum is real, but wind remains a major contributor to the US power mix. Experienced investors may see this as an argument for diversification across both technologies, since each responds to different build-out cycles and output patterns. These are EIA expectations, not guarantees, so it’s worth checking updated figures as the year unfolds.
Data Snapshot: Where the Numbers Stand
Here’s where the verified numbers sit, with each figure labeled as actual, expected, or projected. All figures come from the EIA.
Renewables’ share of US generation
– 2024 (actual): almost 948mn MWh, about 23% of all US generation.
– 2025 (expected): almost 1.1bn MWh, roughly 25%.
– 2026 (projected): 1.2bn MWh, roughly 27%.
Utility-scale solar
– 2025 additions (expected): about 32,500MW.
– 2026 generation (projected): around 350mn MWh.
– Q1 2026 (reported): overtook wind as the largest US clean energy source.
Wind
– 2025 new capacity (expected): about 7,700MW.
– 2026 generation (projected): about 506mn MWh.
Reading across, solar leads on the pace of new additions and the Q1 2026 milestone, while wind still shows higher total projected generation for 2026. Expected and projected figures are EIA outlooks, not guarantees, so treat them as a guide and check the latest EIA releases as actual data comes in.
Why It Matters for Alternative Energy Investors
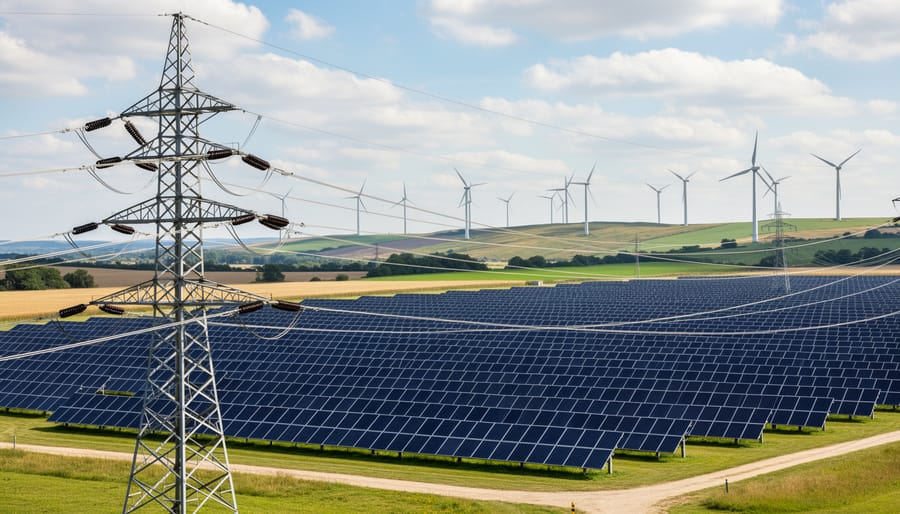
Solar’s lead is a useful signal for investors, but it works best as one input among many. When utility-scale solar overtook wind as the largest US clean energy source in Q1 2026, it showed where growth and attention are concentrating. For newer investors, the takeaway is simple: renewables are a steadily larger part of the grid, with the EIA expecting about 27% of US generation in 2026, up from roughly 23% in 2024.
If you’re building or reviewing investment portfolios resist reading too much into one quarter. Wind is still projected to deliver more total electricity in 2026 (about 506mn MWh) than solar (around 350mn MWh), so both sectors deserve a look rather than a rush toward whichever one grabbed the headline.
Seasoned investors can go a layer deeper. Watch the gap between capacity growth and actual generation: the roughly 32,500MW of solar expected in 2025 and 7,700MW of wind show where developers are building, but output depends on weather, grid conditions and how quickly new projects come online. Supporting areas matter too, and advances in battery technology can shape how well variable solar and wind generation is put to use.
For those researching alternative energy stocks treat sector trends as a starting point for your own homework, not a conclusion. Traditional energy sources remain part of the broader picture, and a balanced view serves most investors well.
What to Watch Next
Knowing what to watch matters more than chasing every headline. A few steady signals can tell you whether this story is a blip or a trend.
First, see whether solar’s lead holds in later periods. The first quarter of 2026 was one data point, and the real question is whether utility-scale solar keeps its edge as the year unfolds. Second, compare actual 2026 generation against the EIA’s expectations, which put solar around 350mn MWh and wind about 506mn MWh. Expectations are a baseline, and the gap between forecast and reality is where interesting insights live. Third, follow updates to capacity additions, since the EIA’s 2025 figures for solar (about 32,500MW) and wind (about 7,700MW) get refined as projects come online.
Policy changes and funding incentives can also influence this sector, but we won’t guess at them here. Check current official sources for the latest details before making any decision.
What does it mean that solar overtook wind?
In the first quarter of 2026, utility-scale solar became the largest source of clean energy in the US, passing wind.
Does this mean wind is declining?
No. The EIA still expects wind to generate more total electricity than solar in 2026, so both remain important.
What’s the difference between MW and MWh?
MW measures how much power a facility can produce at a moment in time, while MWh measures the actual energy produced over time.
Where can I follow updates?
The EIA publishes the underlying data, and Dforce Solar’s news and sector sections track the developments as they come.
So what are you tracking this year? Share your watchlist and swap perspectives with fellow investors in the Dforce Solar discussions.
The big story is simple: utility-scale solar overtook wind as the largest US clean energy source in the first quarter of 2026, while renewables keep claiming a bigger slice of US generation, from about 23% in 2024 toward an expected 27% in 2026. These are EIA-based expectations, not guarantees, and plenty of details are still unsettled.
That’s what makes this market worth following with curiosity and care. Keep exploring the news and sector sections here at Dforce Solar, and join the community conversation to share what you’re watching.